$NVDA 20270319 215.0 PUT$ .
🐶📈 NVDA RSI Strategy Part 1: Why I Sold the $215 Put for $11.30
🟢 My NVDA Trade: Selling the $215 Put
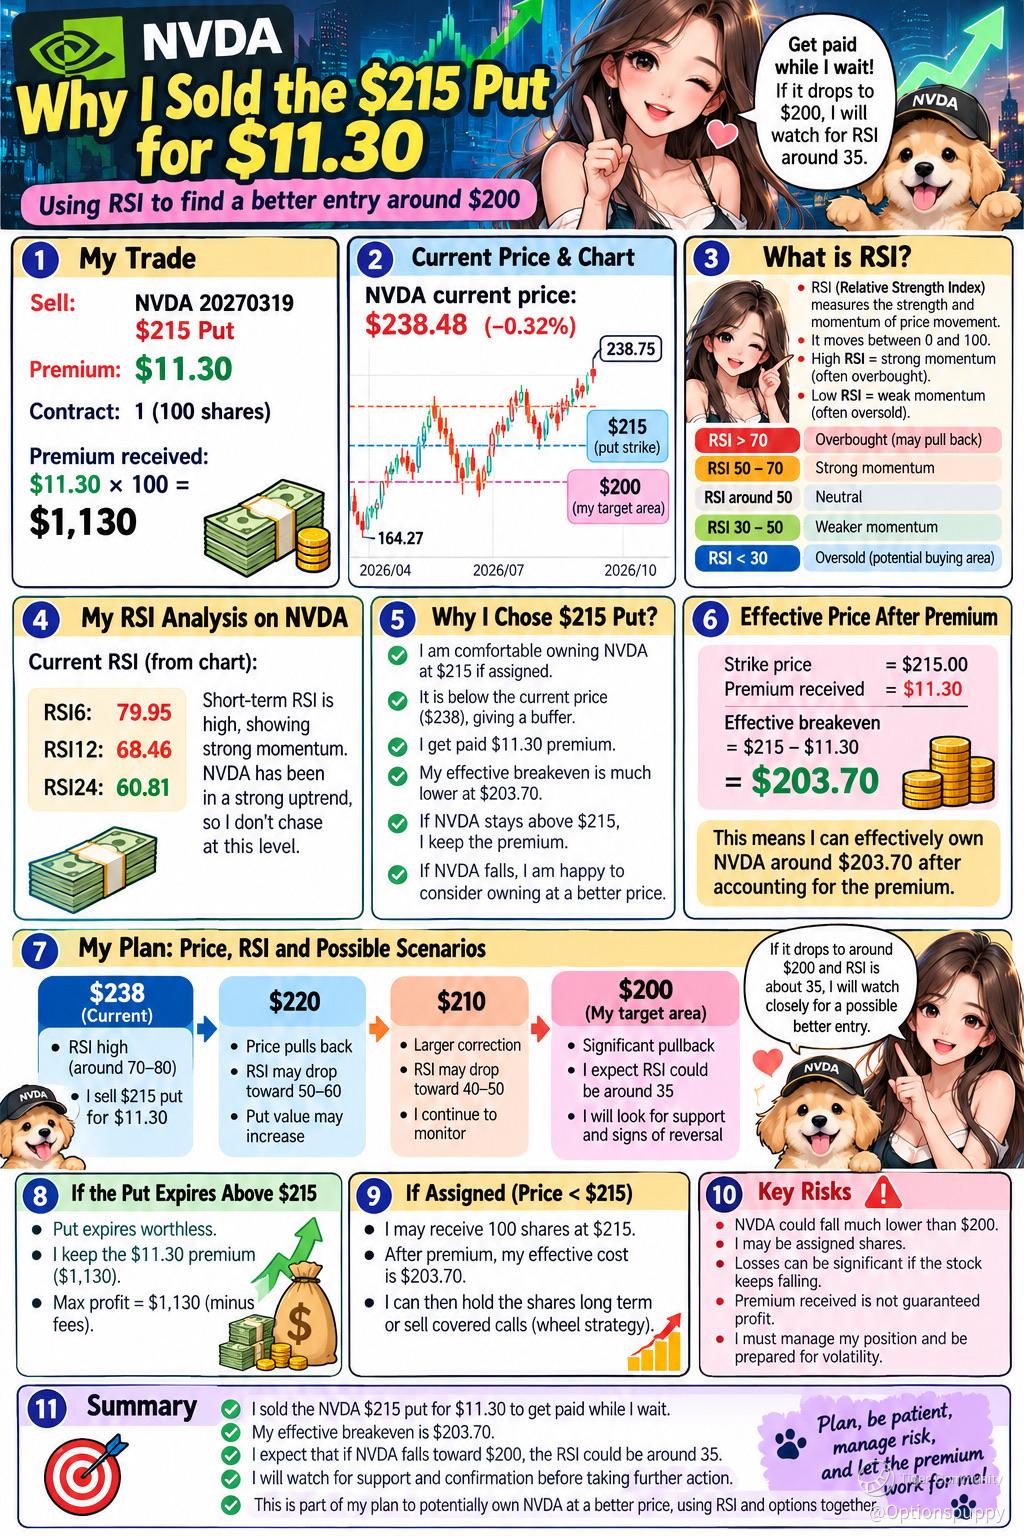
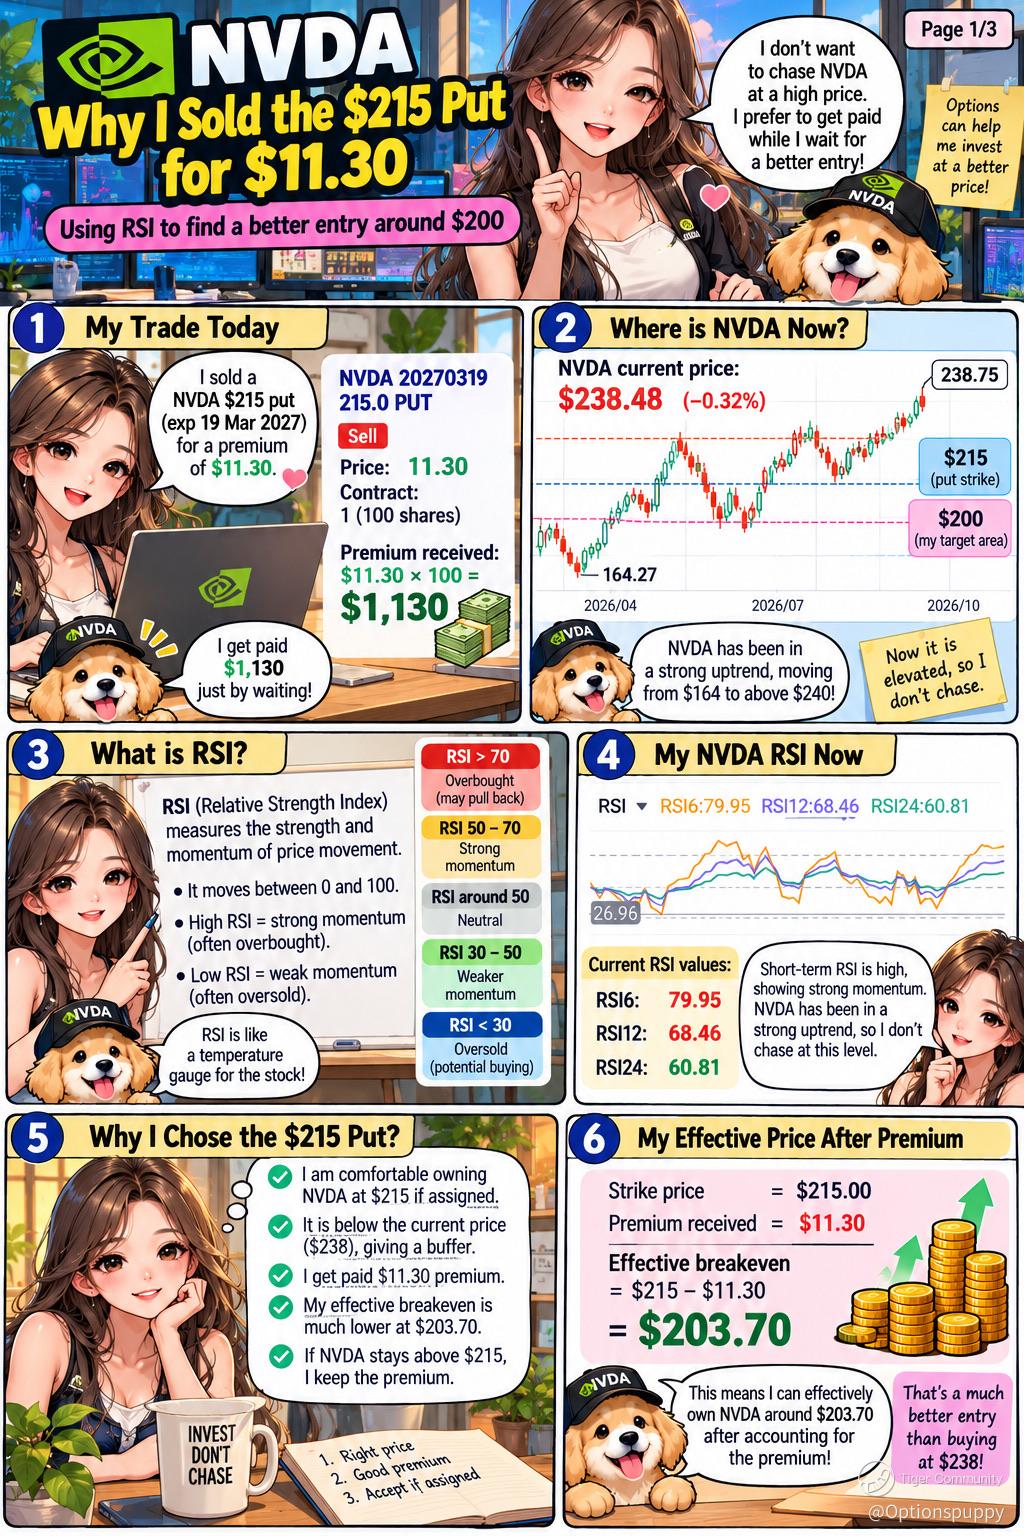
Today I opened a new options trade on NVIDIA (NVDA). With NVDA trading around $238, I decided to sell a March 19, 2027 $215 put and collected a premium of $11.30.
For me, this is not simply a bet that NVDA will stay above $215. My thinking is based on three things: the price I am willing to own NVDA at, the premium I can collect, and the RSI levels that may appear if NVDA experiences a meaningful correction.
My main question is simple:
If NVDA falls toward $200, will the RSI become attractive enough for me to consider the stock oversold or closer to an oversold condition?
That is where my strategy becomes interesting.
⸻
🧠 What Is RSI?
RSI stands for Relative Strength Index. It is a technical indicator that measures the strength and momentum of recent price movements.
The RSI moves between 0 and 100.
Traditionally:
🟢 RSI below 30 = potentially oversold
🟡 RSI around 30–50 = weaker momentum
⚪ RSI around 50 = neutral territory
🟢 RSI around 50–70 = stronger momentum
🔴 RSI above 70 = potentially overbought
However, I don’t treat these numbers as automatic buy or sell signals.
An RSI above 70 does not mean I must sell immediately.
An RSI below 30 does not mean I must buy immediately.
Instead, I use RSI as a temperature gauge.
If the stock is running hot, RSI tells me momentum is strong. If the stock is falling hard, RSI can tell me that selling pressure may have become extreme.
⸻
📊 What My NVDA Chart Is Showing
Looking at my chart, NVDA has been in a strong uptrend.
The price has moved from the lows around $164 earlier in the year to above $240.
That is a huge move.
My chart currently shows:
RSI6: 79.95
RSI12: 68.46
RSI24: 60.81
The short-term RSI is therefore already very high.
For me, that is important.
It tells me that NVDA has strong short-term momentum and has been moving aggressively higher.
But when a stock becomes extended, I also start thinking about what happens if the momentum reverses.
This is where I don’t want to chase the stock.
Instead of buying 100 shares at around $238, I can use an options strategy to potentially acquire NVDA at a much lower effective price.
⸻
🐶 Why I Sold the $215 Put
My selected strike price is $215.
Why $215?
Because I am comfortable considering NVDA around this area.
I don’t want to sell a put at a strike where I would panic if assignment happened.
My philosophy with cash-secured puts is:
If I am not willing to own the stock at the strike price, I shouldn’t sell the put.
For this trade, I am selling the $215 put because I am prepared for the possibility that NVDA falls below $215 and I eventually receive 100 shares.
But I am not getting paid just for taking that risk.
I received a premium of $11.30.
That changes the calculation significantly.
⸻
💰 My $11.30 Premium
One standard US equity option contract represents 100 shares.
Therefore:
$11.30 × 100 = $1,130
So I collected approximately $1,130 in option premium before fees.
This is the important part of my strategy.
If I sold the $215 put and received no premium, my effective purchase price would be $215 if I were assigned.
But because I collected $11.30, my effective breakeven becomes:
$215 − $11.30 = $203.70
So I am effectively saying:
🐶 “I am willing to potentially own NVDA around $203.70 after accounting for the premium.”
That is much more attractive to me than simply buying NVDA around $238.
⸻
🎯 My Real Target Is Around $200
This is where my RSI thinking comes in.
I am watching the $200 area.
Why?
Because $200 is psychologically important, and it would also represent a substantial correction from the current price around $238.
If NVDA eventually falls toward $200, I would expect the RSI to weaken considerably.
My prediction is that if NVDA drops toward $200 during a meaningful correction, RSI could potentially move toward around 35.
I am not saying it must happen.
Technical indicators are not crystal balls.
Instead, I am creating a scenario:
NVDA $238 → correction → $220 → $210 → $200
As the price falls, momentum should normally weaken.
The RSI could move from its current elevated level toward 50, then 40, and potentially toward my estimated 35 area.
That would give me a completely different technical picture from today.
⸻
📉 Why RSI 35 Interests Me
An RSI of 35 is not technically oversold.
Traditional oversold territory is generally below 30.
But for my strategy, RSI 35 can already become interesting.
Why?
Because I don’t necessarily need to wait for RSI to reach 29 or 25.
If NVDA falls substantially while the RSI drops toward 35, I would start watching the stock more closely.
At that point, I would ask:
Is the selling pressure slowing down?
Is NVDA finding support?
Is RSI stabilising?
Is the price forming a reversal pattern?
Is volume showing capitulation?
These questions are more important to me than RSI alone.
⸻
🧮 The Interesting Part: My Breakeven Is $203.70
My trade has a useful mathematical feature.
I sold the $215 put for $11.30.
Therefore:
Strike = $215
Premium = $11.30
Effective breakeven = $203.70
This means NVDA could fall significantly from the current $238 area before I reach my option breakeven.
From approximately $238 to $203.70 is a decline of roughly 14.4%.
That gives me a buffer.
Of course, this does not mean I am protected from losses.
If NVDA falls below $203.70 at expiration, the position would begin losing money.
If NVDA collapsed dramatically, my losses could become substantial.
So I am not treating the $11.30 premium as “free money.”
It is compensation for accepting downside risk.
⸻
🛡️ My Risk Is Still Real
This is one of the most important lessons about selling puts.
When I sell a put, I receive money immediately.
That can make the trade feel safe.
But it isn’t.
If NVDA falls sharply, the put can become very valuable to the buyer and my position can move against me.
For example, if NVDA eventually collapsed to $180, I could be assigned shares at $215.
After the $11.30 premium, my effective cost would be around $203.70.
If the stock were worth $180, I would still have a substantial unrealised loss.
Therefore, I always remind myself:
Premium received ≠ guaranteed profit.
⸻
🐶 My Options Puppy Thinking
This is how I look at the trade.
I don’t want to chase NVDA when everyone is excited.
Instead, I want to get paid while waiting.
At around $238, NVDA is already much higher than my $215 strike.
I therefore give myself a margin between the current market price and my strike.
Then the premium gives me another layer of downside cushion.
My thought process is:
Current NVDA ≈ $238
⬇️
My put strike = $215
⬇️
Premium collected = $11.30
⬇️
Effective breakeven = $203.70
⬇️
My technical area of interest ≈ $200
⬇️
Potential RSI target ≈ 35
That is the structure of my trade.
⸻
📈 What If NVDA Stays Above $215?
This is my ideal scenario.
If NVDA remains above $215 until expiration, the put can expire worthless.
In that case, I keep the premium.
I don’t need NVDA to reach $300.
I don’t need another huge rally.
I simply need the stock to remain above my strike at expiration for the maximum profit scenario.
Of course, I may choose to buy the put back earlier rather than hold until expiration.
For me, options are about managing probabilities and risk—not necessarily holding every contract until expiration.
⸻
📉 What If NVDA Falls Below $215?
This is where my original plan matters.
If NVDA falls below $215, the put can move into the money.
But I don’t automatically panic.
My effective breakeven is around $203.70.
Therefore, I have to distinguish between:
NVDA below $215
and
NVDA below $203.70
These are not the same thing.
The first means my put is potentially in the money.
The second means my position is below its expiration breakeven.
That distinction is extremely important.
⸻
🔥 What If NVDA Falls Toward $200?
This is the scenario I am watching most closely.
If NVDA falls toward $200, I would expect the chart to look very different from today.
The current short-term RSI is elevated.
A large correction could bring RSI down substantially.
My expectation is that around a major pullback toward $200, RSI could potentially approach 35.
If that happens, I would not blindly buy.
Instead, I would look for confirmation.
For example:
📌 RSI stabilising around 35
📌 Price finding support
📌 Selling volume declining
📌 A bullish reversal candle
📌 RSI beginning to turn upward
📌 NVDA holding the $200 area
If several of these happen together, the setup becomes much more interesting to me.
⸻
🧠 RSI Is My Tool, Not My Boss
This is perhaps my biggest lesson from using technical analysis.
I don’t let RSI make the decision for me.
RSI gives me information.
Price gives me information.
Support and resistance give me information.
Options pricing gives me information.
Fundamentals give me information.
I put all these pieces together before deciding what I want to do.
A stock can remain overbought for a long time.
Likewise, a stock can remain oversold for a long time.
Therefore, I never say:
“RSI is 30, so I must buy.”
Instead, I say:
“RSI is 30. Now I want to investigate whether the selling pressure is becoming exhausted.”
That is a much safer way for me to use the indicator.
⸻
🐶 My NVDA Trade in One Picture
My trade can be summarised very simply:
NVDA around $238
➡️ I sell the $215 put
➡️ I collect $11.30 premium
➡️ I receive approximately $1,130
➡️ My effective breakeven becomes approximately $203.70
➡️ I am prepared to own NVDA if assigned
➡️ I watch the $200 area
➡️ If NVDA reaches $200, I expect RSI could potentially approach 35
➡️ If RSI stabilises and price finds support, I reassess the opportunity
That is my plan.
⸻
🏁 My Conclusion
For me, selling the NVDA $215 put for $11.30 is not simply an income trade.
It is a way of combining options premium collection with technical analysis.
NVDA is currently trading well above my strike, while the chart shows strong momentum.
Instead of chasing the stock higher, I chose a lower price where I would be more comfortable potentially owning it.
The $11.30 premium reduces my effective cost from $215 to approximately $203.70.
My next major technical area of interest is around $200.
If NVDA experiences a meaningful correction toward $200, I expect the RSI could potentially fall toward approximately 35.
At that point, I would watch carefully for signs that the selling pressure is slowing.
But I also remind myself that RSI is only one tool.
The trade still carries significant downside risk, and a put seller must always be prepared for assignment and for the possibility that the stock falls far below the strike.
For me, the key philosophy is simple:
🐶 I don’t want to predict every move in NVDA.
💰 I want to get paid while I wait.
📉 If NVDA falls, I want my premium to give me a lower effective entry.
📊 And if the RSI eventually approaches 35 around the $200 area, I will pay much closer attention to the chart.
That is my NVDA RSI strategy.
Part 2 can be about what I would do if NVDA falls to $215, $205 and $200—and how I would manage the put, assignment risk and the next covered-call/wheel strategy.
Important calculation: $215 − $11.30 = $203.70 effective breakeven, before commissions/fees. The $11.30 premium represents about $1,130 per standard 100-share contract.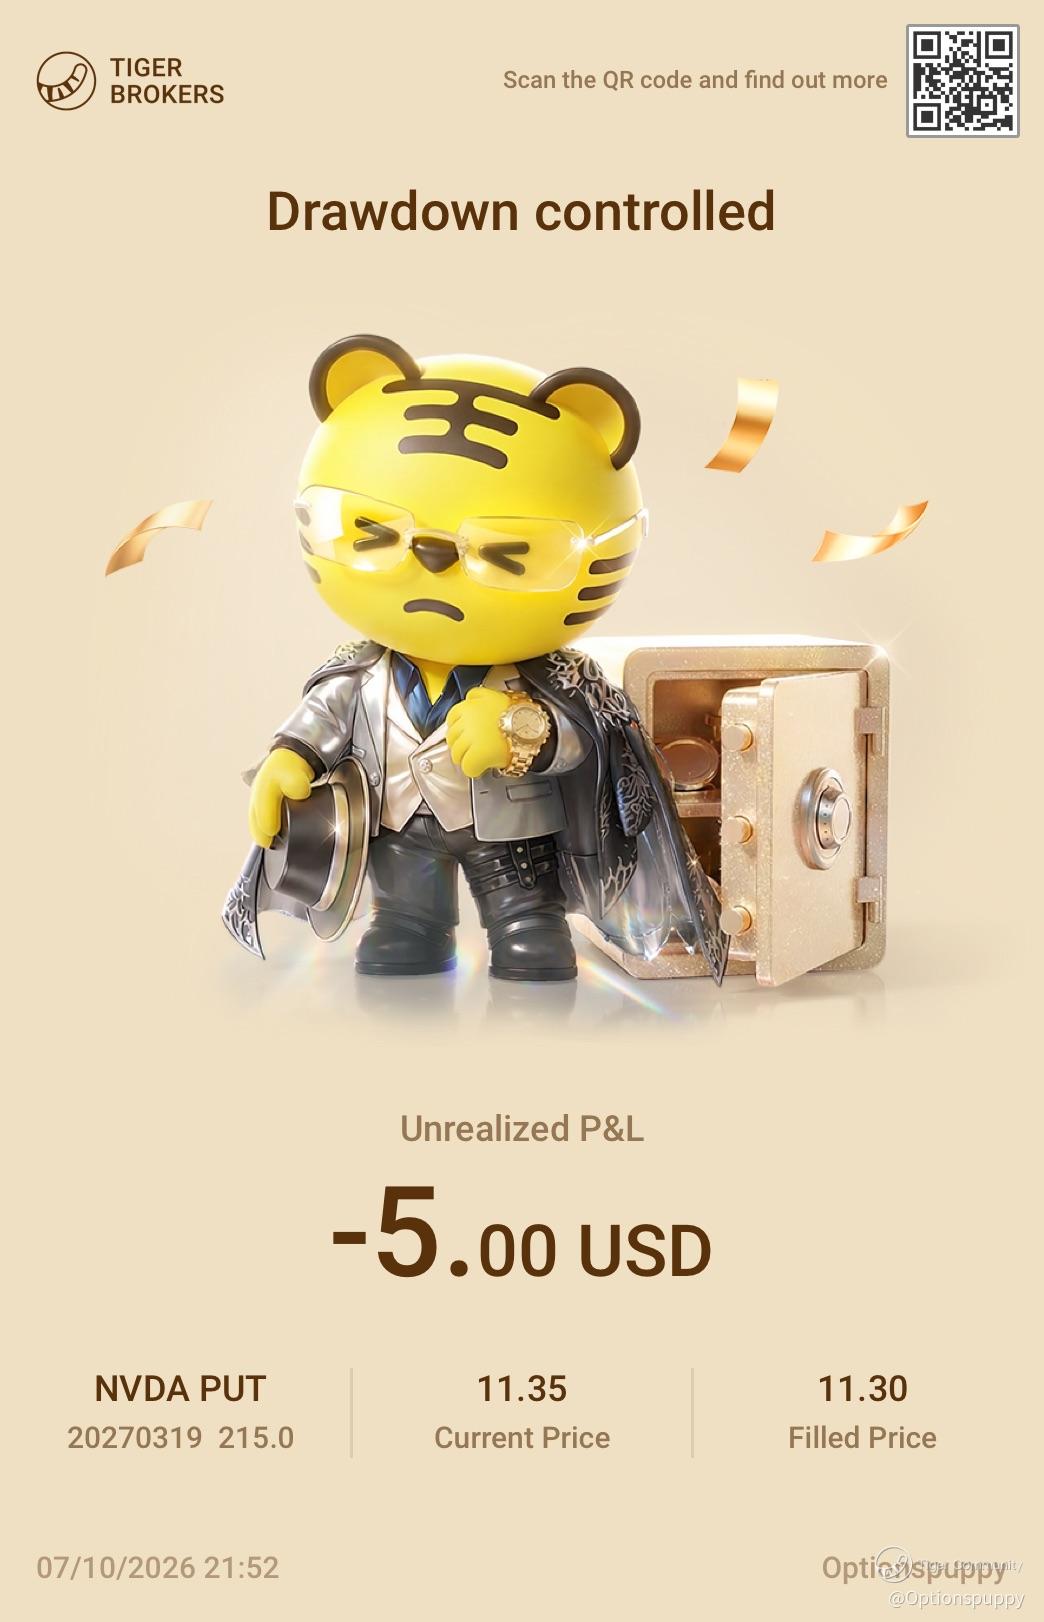
| Side | Price | Filled | Realized P&L |
|---|
| Sell Open | 11.30 1Lot(s) | -- Closed |
Disclaimer: Investing carries risk. This is not financial advice. The above content should not be regarded as an offer, recommendation, or solicitation on acquiring or disposing of any financial products, any associated discussions, comments, or posts by author or other users should not be considered as such either. It is solely for general information purpose only, which does not consider your own investment objectives, financial situations or needs. TTM assumes no responsibility or warranty for the accuracy and completeness of the information, investors should do their own research and may seek professional advice before investing.


