


Figma soared 250%, how to play short-term hedging?
Design Collaboration Platform$Figma (FIG) $It landed on the New York Stock Exchange on July 31, and its stock price soared 250% on the first day of listing, detonating the market. As of the close, Figma's valuation was as high as US $56.3 billion (about 406.9 billion yuan), making it the highest-valued listed software company since the ebb of the US stock IPO boom in 2021. In addition, after years of waiting, the company's early-stage investment institutions have obtained billions of dollars in rich returns.
What does Figma do?
Founded in 2012, Figma focuses on online UI design tools. Because it supports multi-person real-time collaboration, cloud-based seamless version control, and perfect plug-in ecosystem, it has become an innovative representative in the industry.
The company founders are Dylan Field and Evan Wallace. The two met when they were studying in college. At that time, Wallace was studying graphics and was a teaching assistant in the computer science department, while Field was an undergraduate student in the computer science department. In May 2012, after receiving an entrepreneurial bonus from Thiel Fellowship, Field dropped out of college and started a business with Wallace.
In 2020, due to the outbreak of COVID-19 pandemic, home online office became the mainstream, and the number of users of Figma's online design platform began to grow rapidly. From 2021 to 2025, the compound annual revenue growth rate in the past four years will be 53%.
In May of this year, Figma launched four new tools, including Figma Sites, Figma Make, Figma Buzz and Figma Draw, increasing its core product line from four to eight and focusing more on areas such as no-code website building.
In 2022, software design giant Adobe made an acquisition offer of up to US $20 billion in an attempt to win Figma, but this merger eventually failed in 2023 due to regulatory resistance. Although the transaction failed, Figma benefited a lot from it-Adobe paid a "breakup fee" of US $1 billion, providing sufficient ammunition for its subsequent product polishing, AI capability expansion and profit acceleration.
In addition, the company began to deeply embed artificial intelligence into product processes. The platform supports the generation of editable interfaces through natural language prompts, and has the advantages of a more open design process-seamless version control, real-time collaboration in files, etc. Field said that the company has invested heavily in AI and plans to double down on this area. AI spending may drag down the company's gross profit margin for several years, but AI is also at the core of future design workflow development.
The prospectus shows that the company's revenue in 2024 will be US $749 million, a year-on-year increase of 48%. In the first quarter of 2025, revenue was $228 million, a year-on-year increase of 46%, and net income was $44.9 million. At this rate, Figma's revenue this year is expected to exceed the $1 billion milestone. As of March 2025, Figma has 1,031 major customers with annual payments exceeding US $100,000, a year-on-year increase of 47%. The customer list includes first-line technology companies such as Netflix, Duolingo, and Stripe.
He added: "The problem is the current market environment. It feels like the market is reflecting positive developments ahead of time. As we have always stressed, sentiment is high and implied growth expectations are high."
For investors who hold FIGMA but are worried about the short-term increase being too high and worried, they can consider using the collar strategy for appropriate hedging.
What exactly is the collar strategy?
To protect the downside risk of stocks, there is a strategy of buying put options (Protective Put), and to reduce the cost of holding stocks, you can sell Covered Call options (Covered Call). In order to take care of both, Collar options-this new strategy was born.
The operation method of collar option is to buy an out-of-the-money put option as insurance on the premise of holding stocks, and at the same time sell an out-of-the-money call option to pay the cost of insurance. This is equivalent to putting a Collar on the stock, and the income of the stock is locked in it, hence the name of the Collar option. The collar option is in fact a combination of Protective Put and Covered Call, which limits the risk of downside at the expense of removing some of the possibility of upside profit.
Collar options are available when traders have a bullish position in the underlying market and want to protect the position from market downside shocks. When the full cost of a put option is covered by selling a call option, it is called a zero-cost collar strategy.
FIGMA Collar Options Strategy Case
Suppose an investor holds 100 shares of Figma with a current price of $122. The investor is not sure how the price will change in the near future and wants to buy an insurance policy for his position. You can use the collar strategy.
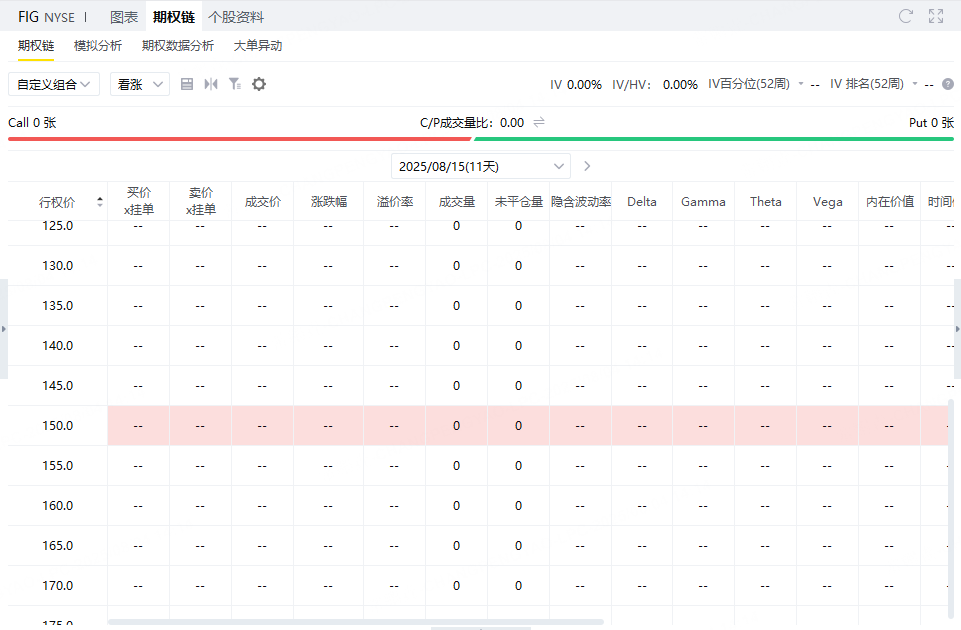
In the first step, investors can sell a call option with an exercise price of $150 and an expiration date of August 15th.
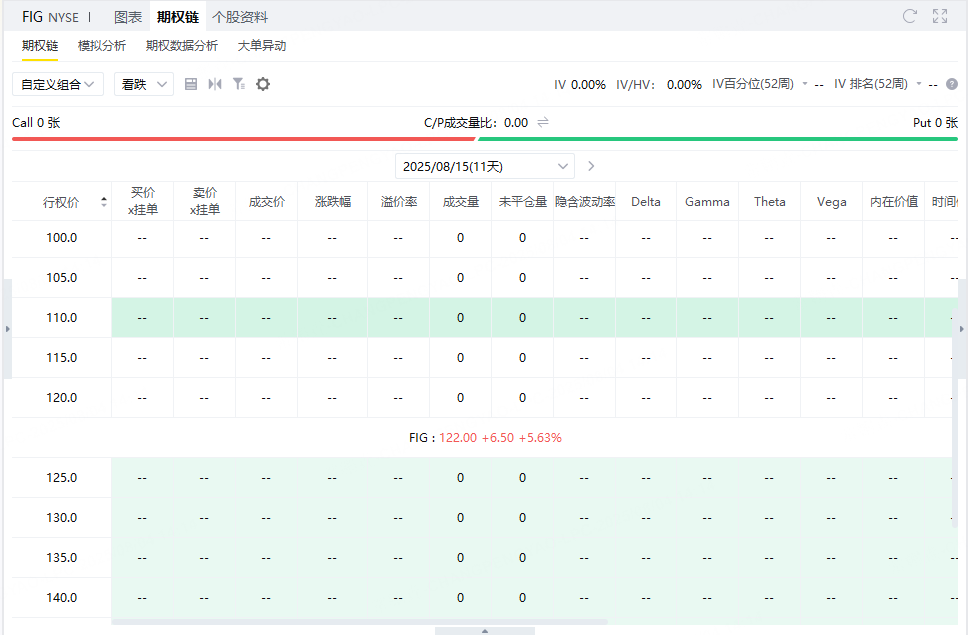
In the second step, you can also buy a put option with an exercise price of $110 and an expiration date of August 15.
Profit and loss analysis: Figma collar strategy (Protective Collar)
Investors currently hold 100 shares of Figma at a market price of $122. In order to prevent downside risks and reduce protection costs, they adopt a collar strategy:
SellA Call option (Call) with an exercise price of $150 expiring on August 15, charging premium (assuming $2.00/share, or $200)
BUYA Put option (Put) with an exercise price of $110 expiring on August 15, paying premium (assuming $3.00/share, or $300)
Maximum profit:
The stock price rises to or above $150, the stock portion is restricted to earnings, but the call option is exercised:
The stock rose from 122 to 150, an increase of $28 × 100 =$2800
The call option sold at the same time is exercised at 0 cost (the loss increases by more than 150)
Net income premium $200 (Call)-$300 (Put) =-$100
Maximum Profit = $2800-$100 = $2700
Maximum loss:
The share price drops to or below $110, triggering a protective put:
The stock fell from 122 to 110, losing $12 × 100 =$1200
The put option is exercised, the stop loss is at 110, and the loss will not continue
Net premium =-$100
Maximum loss = $1200 + $100 = $1300
Break-even point:
Upward: Shares rose to about$123(122 current price + $100 premium loss ÷ 100 shares)
Downward: Shares fell to about$111(122 current price-$1100 stock loss + $100 net premium ÷ 100 shares)
This strategy is suitable for use when there are bearish concerns but you don't want to give up the upside opportunity entirely:
Earnings Limited, but Downside Protection
Low cost (possibly even net premium)
Only outside the range will extreme profit and loss results be triggered, which helps to psychologically stabilize positions
Disclaimer: Investing carries risk. This is not financial advice. The above content should not be regarded as an offer, recommendation, or solicitation on acquiring or disposing of any financial products, any associated discussions, comments, or posts by author or other users should not be considered as such either. It is solely for general information purpose only, which does not consider your own investment objectives, financial situations or needs. TTM assumes no responsibility or warranty for the accuracy and completeness of the information, investors should do their own research and may seek professional advice before investing.
