The short‑term Elliott Wave view in Gold (XAUUSD) shows that the yellow metal has completed a three‑swing correction from the April 17, 2026 high. The pullback unfolded as a zigzag, with wave A ending at $4499.92 and wave B at $4773.58. Gold then declined in wave C to $4365.13, completing wave (2) as seen on the one‑hour chart. This level sits inside the key support zone, where wave C equals the 100%–161.8% Fibonacci extension of wave A. The broader support area spans $4137–$4380. After testing this zone, Gold began a strong impulsive rally. The advance signals renewed momentum, but confirmation requires a break above the April 17 peak at $4890.97, which marked the end of wave (1). In the near term, wave (i) of the new cycle should finish soon. A corrective pullback in wave (ii) is expecte
Elliottwave_ForecastOfficial Account
Tiger Certification: Elliott Wave Forecasts of 78 markets.
0Follow
9958Followers
Elliott Wave Forecasts of 78 markets.
Gold (XAUUSD) Price Action: Strong Elliott Wave Impulsive Reaction from Key Support Zone
Gold (XAUUSD) Price Action: Strong Elliott Wave Impulsive Reaction from Key Support Zone
Buyers Likely to Support Nikkei Futures (NKD) Pullback, Eyeing 72,870 Extension
Nikkei Futures (NKD) continues to demonstrate remarkable strength as it extends into new all‑time highs, reinforcing the bullish sequence that began from the March 23, 2026 low. This upward momentum favors additional gains in the near term. From the March 23 low, wave 1 concluded at 63,880, followed by a corrective pullback in wave 2 that ended at 59,352. The internal subdivision of wave 2 unfolded as a zigzag, a common corrective structure, before the Index resumed higher. The decisive break above the wave 1 peak confirmed that wave 3 had begun, signaling continuation of the impulsive advance. From wave 2, the initial leg wave (i) ended at 62,075, while the subsequent pullback in wave (ii) found support at 61,040. The rally extended further, with wave (iii) reaching 65,695, before a modes
Buyers Likely to Support Nikkei Futures (NKD) Pullback, Eyeing 72,870 Extension
Buyers Likely to Support Nikkei Futures (NKD) Pullback, Eyeing 72,870 Extension
Nikkei Futures (NKD) continues to demonstrate remarkable strength as it extends into new all‑time highs, reinforcing the bullish sequence that began from the March 23, 2026 low. This upward momentum favors additional gains in the near term. From the March 23 low, wave 1 concluded at 63,880, followed by a corrective pullback in wave 2 that ended at 59,352. The internal subdivision of wave 2 unfolded as a zigzag, a common corrective structure, before the Index resumed higher. The decisive break above the wave 1 peak confirmed that wave 3 had begun, signaling continuation of the impulsive advance. From wave 2, the initial leg wave (i) ended at 62,075, while the subsequent pullback in wave (ii) found support at 61,040. The rally extended further, with wave (iii) reaching 65,695, before a modes
Buyers Likely to Support Nikkei Futures (NKD) Pullback, Eyeing 72,870 Extension
How to Trade Gold Using Elliott Wave – Expert Guide
Gold has always been one of the most attractive assets for traders and investors. During periods of inflation, geopolitical uncertainty, banking instability, or weakness in the US Dollar, traders often rush toward gold as a safe-haven asset. This continuous flow of fear and greed creates strong price swings that make gold one of the best instruments for technical analysis. However, gold is also highly volatile. Many traders lose money because they enter too early, trade emotionally, or fail to understand market cycles. This is where Elliott Wave Theory becomes extremely valuable. Elliott Wave Theory helps traders understand how markets move in repeating cycles driven by human psychology. Instead of reacting emotionally to news headlines, traders can use wave structures, Fibonacci retraceme
How to Trade Gold Using Elliott Wave – Expert Guide
How to Trade Gold Using Elliott Wave – Expert Guide
Gold has always been one of the most attractive assets for traders and investors. During periods of inflation, geopolitical uncertainty, banking instability, or weakness in the US Dollar, traders often rush toward gold as a safe-haven asset. This continuous flow of fear and greed creates strong price swings that make gold one of the best instruments for technical analysis. However, gold is also highly volatile. Many traders lose money because they enter too early, trade emotionally, or fail to understand market cycles. This is where Elliott Wave Theory becomes extremely valuable. Elliott Wave Theory helps traders understand how markets move in repeating cycles driven by human psychology. Instead of reacting emotionally to news headlines, traders can use wave structures, Fibonacci retraceme
Elliott Wave View: Russell 2000 (RTY) Surges to Record High, Launches Fresh Bull Cycle
Russell 2000 Futures (RTY) has broken to a new all‑time high, initiating a fresh bullish cycle. The rally from the March 30, 2026 low concluded with wave (1) at 2918.4. Afterward, the Index corrected in wave (2), which ended at 2728.3, as shown in the one‑hour chart. The internal subdivision of wave (2) unfolded as a double three Elliott Wave structure. From the peak of wave (1), wave W finished at 2807.9, while wave X ended at 2881.4. Wave Y then moved lower and completed at 2728.3, marking the end of wave (2) in higher degree. With the correction complete, the Index resumed its advance and broke above the wave (1) high, confirming that wave (3) has begun. The rally from the wave (2) low is unfolding as a five‑wave impulse. Wave 1 of (3) is expected to finish soon. A pullback in wave 2 sh
Elliott Wave View: Russell 2000 (RTY) Surges to Record High, Launches Fresh Bull Cycle
$AMZN Blue Box Area Offering Buying Opportunity After 7 Swing Pullback
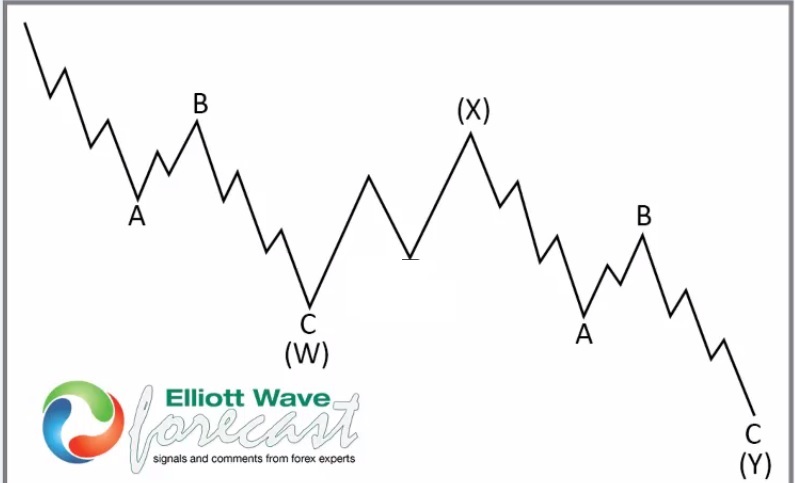
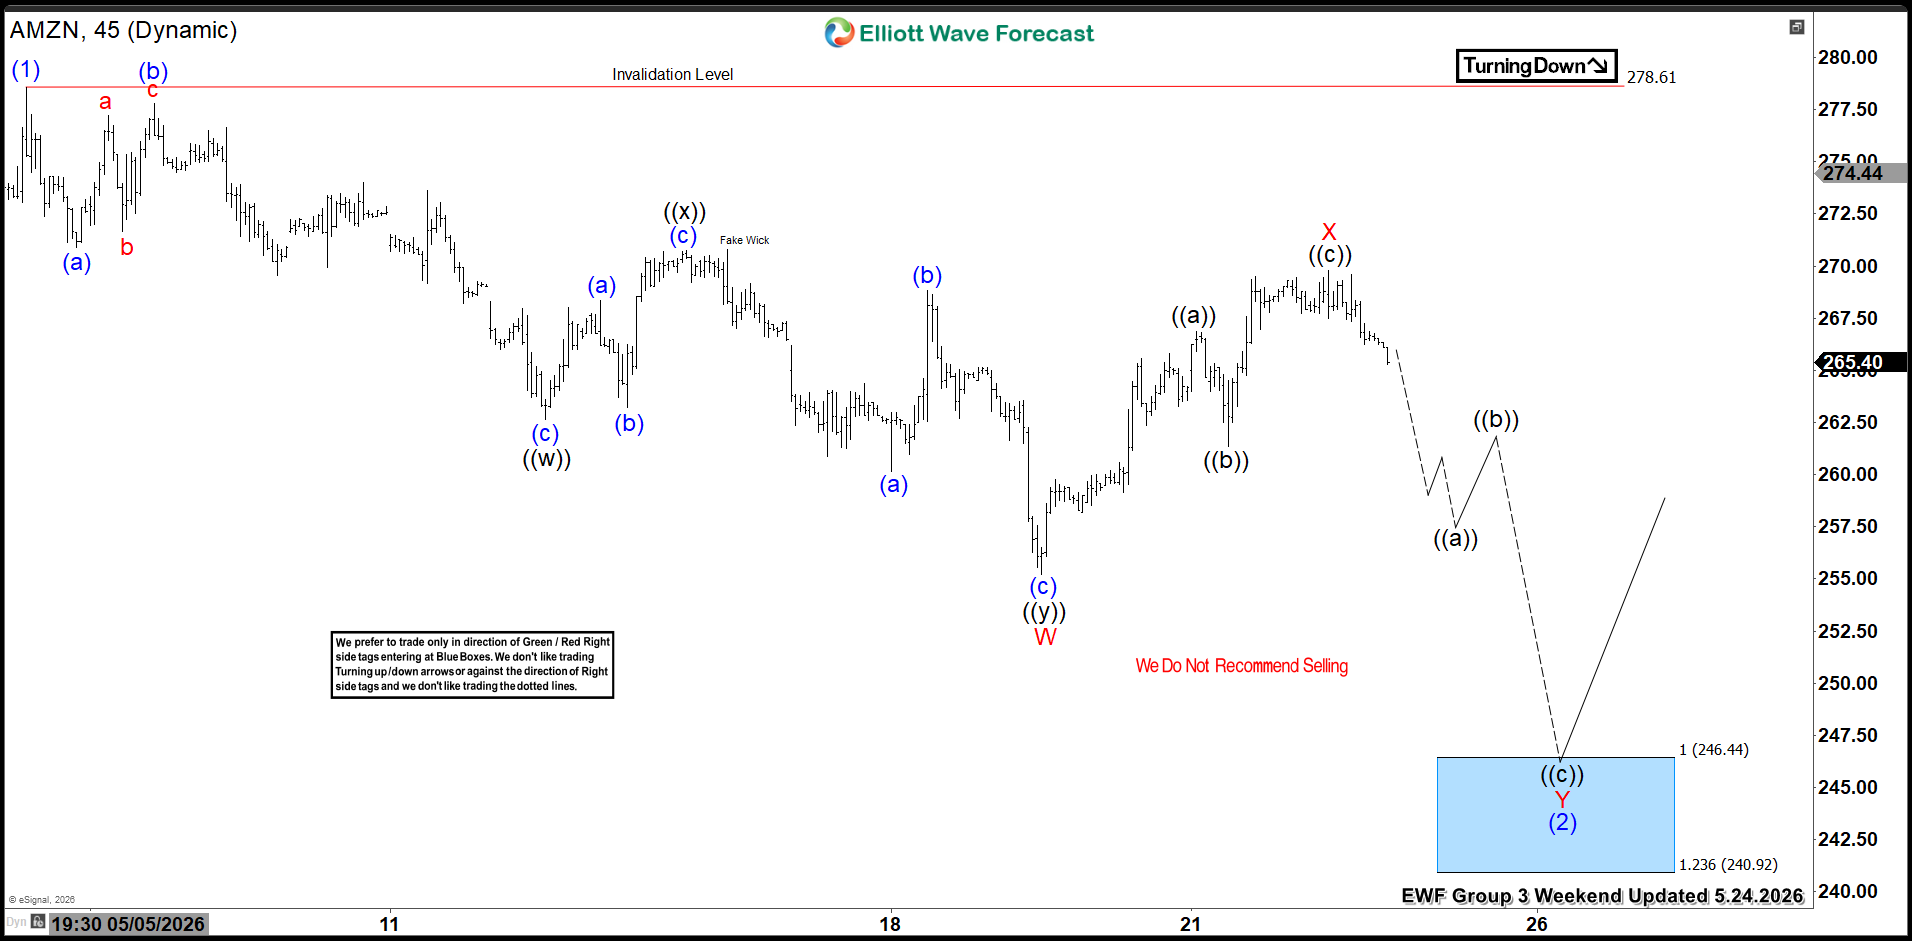
In this Elliott Wave update, we look at the latest structure in Amazon.com Inc. ($AMZN). The stock appears to have ended the bullish cycle from February 2026 and has since turned lower in a larger corrective pullback. However, the decline still looks corrective rather than impulsive. As a result, $AMZN is now pulling back in 7 swings, and the current structure is opening a Blue Box Area buying opportunity. 5 Wave Impulse + 7 Swing WXY correction $NVDA $NVDA $AMZN Ended the Cycle From February 2026 $AMZN Looking at the 45-minute chart, $AMZN completed the rally from the February 2026 cycle and then started to correct lower. After reaching a meaningful high, the stock failed to extend further and shifted into a bearish swing sequence. This change matters because it suggests the
$AMZN Blue Box Area Offering Buying Opportunity After 7 Swing Pullback
$AMZN Blue Box Area Offering Buying Opportunity After 7 Swing Pullback
In this Elliott Wave update, we look at the latest structure in Amazon.com Inc. ($AMZN). The stock appears to have ended the bullish cycle from February 2026 and has since turned lower in a larger corrective pullback. However, the decline still looks corrective rather than impulsive. As a result, $AMZN is now pulling back in 7 swings, and the current structure is opening a Blue Box Area buying opportunity. 5 Wave Impulse + 7 Swing WXY correction $NVDA $AMZN Ended the Cycle From February 2026 Looking at the 45-minute chart, $AMZN completed the rally from the February 2026 cycle and then st
$AMZN Blue Box Area Offering Buying Opportunity After 7 Swing Pullback
Elliott Wave View: Dow Futures (YM) Break Higher Following March 2026 Correction
The short‑term Elliott Wave outlook for Dow Futures (YM) indicates that the Index has completed its correction against the cycle from the March 30, 2026 low and has resumed higher. The rally from that low is unfolding as a clear impulse. Within this structure, wave 1 terminated at 50,043, while the subsequent pullback in wave 2 found support at 48,608. From there, the Index extended upward in wave 3, which itself subdivides into another impulsive sequence. Advancing from wave 2, wave ((i)) concluded at 50,292, as illustrated in the one‑hour chart. The pullback in wave ((ii)) then ended at 49,146, establishing a pivotal low. The Index has since resumed its ascent in wave ((iii)) of 3. From wave ((ii)), the internal wave (i) is expected to complete shortly. Following that, a corrective pullb
Elliott Wave View: Dow Futures (YM) Break Higher Following March 2026 Correction
Bitcoin (BTCUSD) Surges Higher From Key Support Zone
The short‑term Elliott Wave outlook for Bitcoin (BTCUSD) shows the rally from the March 29 low concluded as wave 1 at $82,833. After this peak, the market corrected in wave 2, unfolding as a double three Elliott Wave structure. From the wave 1 high, wave (a) ended at $79,168. The rally in wave (b) reached $82,458. Wave (c) then dropped to $78,704, completing wave ((w)) at a higher degree. Bitcoin rebounded in wave ((x)), which finished at $82,047, setting up the next decline. The cryptocurrency extended lower in wave ((y)), which subdivided into a zigzag structure. From the wave ((x)) high, wave (a) ended at $77,614. A modest rally in wave (b) concluded at $78,573. The final leg, wave (c), dropped to $76,072, completing wave ((y)) of wave 2 at a higher degree. This decline brought Bitcoin
Bitcoin (BTCUSD) Surges Higher From Key Support Zone
Elliott Wave Outlook: GDX Approaches Key Support Zone $78.6– $82 Range
The short‑term Elliott Wave outlook for Gold Miners ETF (GDX) shows a correction unfolding from the March 20, 2026 low. This move is developing as a zigzag structure, a common three‑wave corrective pattern. From the March 20 high, wave (A) ended at $85.46, followed by a rally in wave (B) that reached $98.74. The ETF has since turned lower, with wave (C) now in progress and subdividing into five smaller waves. From the peak of wave (B), wave 1 concluded at $92.85. A corrective rally in wave 2 then advanced to $97.56. The ETF extended lower in wave 3, which is expected to finish soon. Afterward, a rally in wave 4 should emerge, likely in three or seven swings, before a final decline in wave 5 completes wave (C). The downside target aligns with the 100% Fibonacci extension of wave (A) and the
Elliott Wave Outlook: GDX Approaches Key Support Zone $78.6– $82 Range
Gold Miners ETF (GDX) Forecasting the Rally After 3 Waves Pull Back
Hello fellow traders. In this technical article, we take a quick look at the Elliott Wave charts of the Gold Miners ETF (GDX), published in the members’ area of our website. The ETF shows bullish impulsive sequences on both the daily and weekly charts. The structure points to a strong uptrend, with higher highs and higher lows. Pullbacks should find support in key areas, offering buying opportunities. In the following sections, we explain the Elliott Wave structure, highlight key levels, and outline possible scenario. We focus on trading with the trend and avoid selling while the bullish sequence remains intact. GDX Elliott Wave 4 Hour Chart 3.23.2026 Current analysis suggests GDX is close to completing wave (IV) (blue) as an ABC zigzag. The extreme zone has already been reache
Gold Miners ETF (GDX) Forecasting the Rally After 3 Waves Pull Back
Mastercard Inc (NYSE: MA) Enters Extreme Area
Mastercard Inc (NYSE: MA) is undergoing a weekly correction. Today, we dive into its technical chart. Our analysis explores the Elliott Wave structure and projected target for the current cycle. MA completed an impulsive five-wave advance from its 2022 low of 277.79. Wave I peaked at $582. From that high, a three-wave flat correction is now unfolding. Wave ((A)) ended at 465. Then, Then, wave ((B)) reached $601. Currently, wave ((C)) remains in progress. The stock already reached the equal legs zone ( $511 − $463) . This area should conclude wave II. Consequently, a bullish reversal will take place from this zone and Mastercard will look to resume the rally higher in wave III into new all time highs. Mastercard (MA) Weekly Chart 5.20.2026 MA Weekly Chart 5.20.2026 Conclusion Mast
Mastercard Inc (NYSE: MA) Enters Extreme Area
EURUSD Zigzag Correction Points to Elliott Wave Support at 1.148–1.160
EURUSD is unfolding a corrective zigzag structure from the April 17, 2026 high. First, wave A ended at 1.1655, establishing the initial leg of the decline. Then, wave B rallied to 1.1796, as shown on the one‑hour chart. From that point onward, wave C began to progress lower, subdividing into five smaller waves. This subdivision aligns with Elliott Wave guidelines and confirms the corrective nature of the move. Specifically, wave ((i)) concluded at 1.1722, after which wave ((ii)) rallied to 1.1788. Subsequently, the pair resumed its decline in wave ((iii)), which extended toward 1.1608. Now, wave ((iv)) is advancing as a rally. Importantly, resistance should appear in the 1.168–1.171 zone, where sellers may re‑emerge. Moreover, as long as the pivot at 1.18 holds, rallies are likely to fail
EURUSD Zigzag Correction Points to Elliott Wave Support at 1.148–1.160
SPY Launches Strong Bullish Rally from Blue Box Zone
In this technical blog, we will look at the past performance of the Daily Elliott Wave Charts of SPY. In which, the rally from 07 April 2025 low ended in an impulse sequence & showed higher high sequence in weekly structure therefore, called for an extension higher to take place. We knew that the structure in SPY should remain supported & extend higher. So, we advised members not to sell the ETF & buy the dips in 3, 7, or 11 swings at the blue box areas. We will explain the structure & forecast below: SPY Daily Elliott Wave Chart From 3.29.2026 SPY Launches Strong Bullish Rally from Blue Box Zone Here’s the Daily Elliott wave Chart from the 3.29.2026 Weekend update. In which, the rally to $697.84 high completed wave ((1)) & made a pullback in wave ((2)) to correct the c
SPY Launches Strong Bullish Rally from Blue Box Zone
Costco (COST) Looking For Break Out For Targeting $1515
Costco Wholesale Corporation., (COST) engages in the operation of membership warehouse in the United States & globally together with its subsidiaries. It offers branded & private-label products in the range of merchandise categories. It also operates e-commerce websites in the US, Canada, UK & many other countries. It comes under Consumer Defensive sector & trades as “COST” ticker at Nasdaq. In weekly, COST is bullish nested impulse sequence & expect rally against May-2022 low, while dips remain above $844.06 low. It is close to break above February-2025 high of $1080. Once it breaks above that level, buyers should buy the pullback for targeting $1515 or higher. COST – Elliott Wave Latest Weekly View: It ended ((I)) in weekly at $612.27 high in April-2022 & ((II)) a
Costco (COST) Looking For Break Out For Targeting $1515
Go to Tiger App to see more news