Remember at the beginning of the year, numerous reports projected that the Federal Reserve would cut interest rates four times. However, following the surge in oil prices, the market has swung from one extreme to another. Today, hardly anyone dares to anticipate any rate cuts this year. In fact, working backward from the latest U.S. Treasury yield data, the market has even begun to price in potential rate hikes starting in October.
This dramatic shift—going from extreme euphoria to sheer panic in just two to three weeks—clearly demonstrates that market trends are currently driven by future sentiment and expectations rather than genuine, medium-to-long-term fundamental changes. Investors must deeply understand this reality. Predictably, if the strait blockade eventually concludes and rate cut expectations resurface, the market might return to a euphoric frenzy at the exact same blistering pace. During this process, investors need to ask themselves whether they can adapt to the current market rhythm. If not, the best approach is to reduce your exposure and patiently observe from the sidelines.
$Gold - main 2604(GCmain)$ $E-Micro Gold - main 2604(MGCmain)$ $1-Ounce Gold - main 2604(1OZmain)$ $Silver - main 2605(SImain)$ $E-mini Silver - main 2605(QImain)$ $Silver - Mar 2026(SI2603)$ $iShares Silver Trust(SLV)$ $Copper - main 2605(HGmain)$
Why Are Precious Metals Plummeting?
Many investors are puzzled as to why gold is falling despite an ongoing war. When the global economy is relatively stable and liquidity (often referred to as "hot money") is abundant, precious metals are highly favored as a safe haven for value preservation. However, when the economy falters and liquidity dries up, highly liquid assets become prime targets for sell-offs.
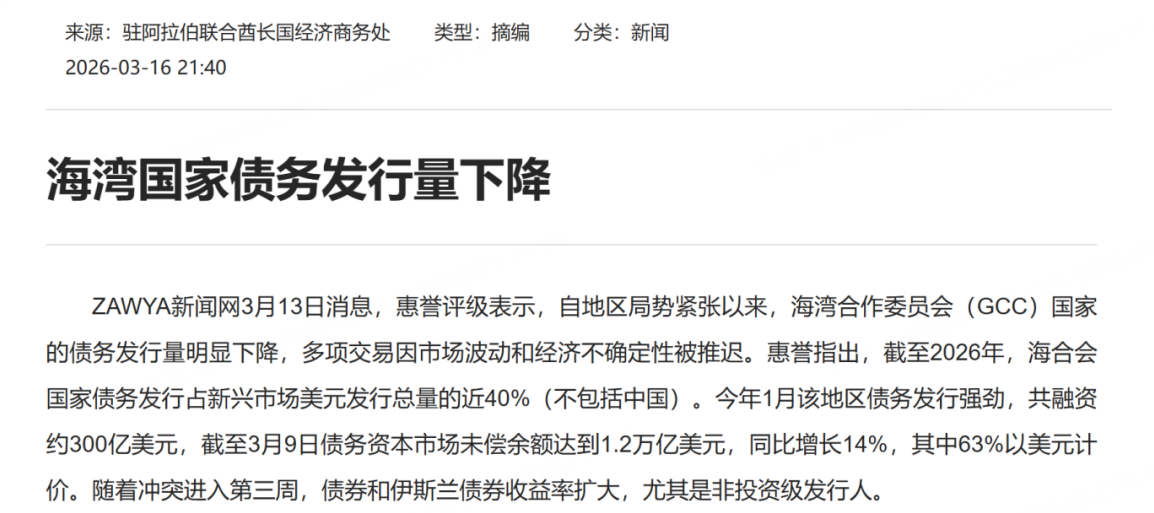
Currently, with the strait blocked, massive energy exports from Gulf nations such as Saudi Arabia, Qatar, and the UAE are severely obstructed. Without outbound energy shipments, there is no incoming revenue. Over time, these producing nations experience extremely tight cash flows. The most effective assets to liquidate and replenish cash flow are precious metals. They are sold off for cash to cover other international financial obligations (since gold itself is not a direct means of payment).
Therefore, the aggressive sell-off in precious metals is driven not only by rate hike expectations but, more importantly, by a severe liquidity crunch in the Gulf region. Gulf countries are forced to liquidate assets like gold or U.S. Treasuries to maintain basic operations. The longer this situation persists, the more intense this dynamic will become, meaning everyone must be mentally prepared for substantial market volatility. Naturally, once the blockade is lifted, market expectations will reverse once again, likely triggering even larger rebound volatility.
Technical Outlook and Risk Management for Gold and U.S. Equities
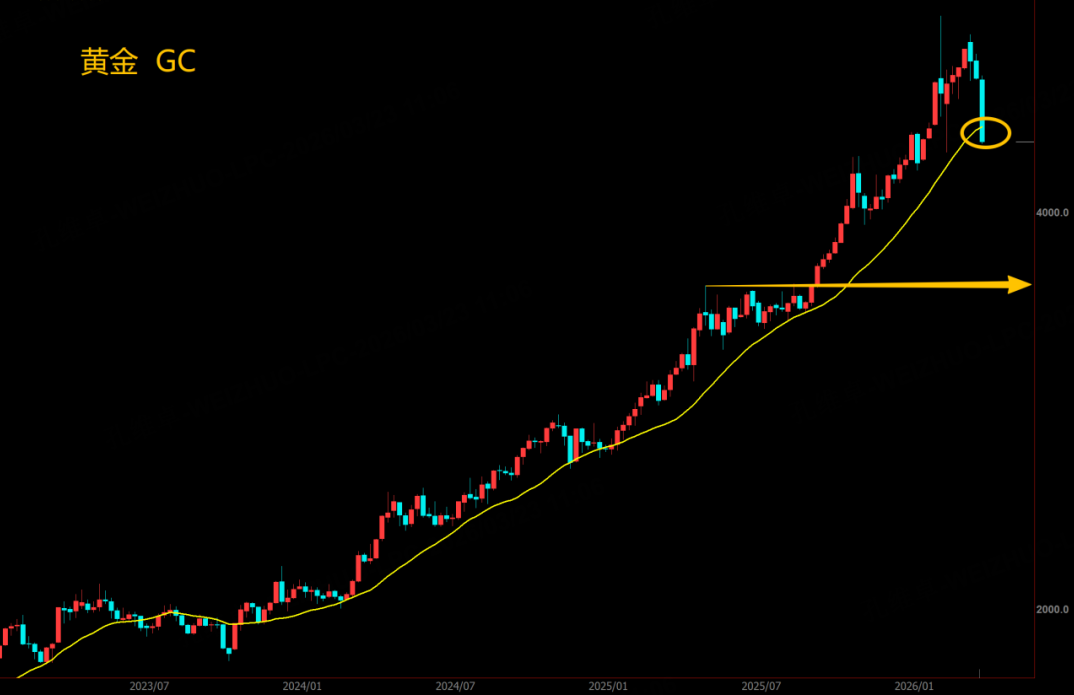
During my live broadcast last Thursday night, I explicitly warned viewers that the 10-week moving average (at the 4650 level) serves as gold's long-term trendline. If it breaks below this level, risk avoidance should be your absolute priority, because no one can accurately predict when the strait will be unblocked. During the 2008 financial crisis, gold prices plunged by over 35% from their peak; therefore, it would not be surprising to see gold drop below 4000 this time around. Investors must seriously consider whether their portfolios can withstand the risk of prices declining to around 3650 (which represents a 35% drop from the highs).
In the face of such extreme events, one can never be too cautious about risk management.
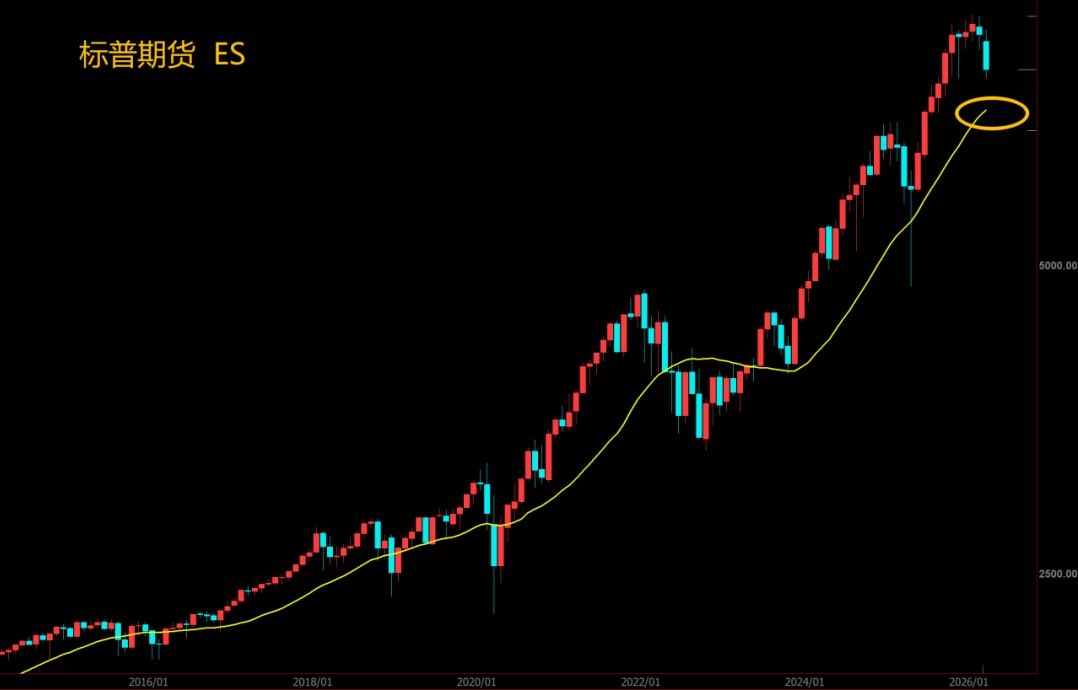
As for U.S. stock indices, we have yet to see an accelerated downward spiral. However, given that these indices have already breached their 20-week moving averages, investors should maintain a short-to-medium-term bearish mindset and ensure they have adequate downside protection.
Technically, the long-term support for U.S. indices rests at the 20-month moving average, currently situated around 6250 for the S&P 500 and 22500 for the Nasdaq. Should the indices fall to these levels, they may encounter robust support. Nevertheless, confirming an ultimate bottom still hinges on the resolution of key events, such as the lifting of the strait blockade. After all, the political motivation to prop up the market ahead of the midterm elections remains a critical factor keeping U.S. stock indices relatively stronger than those of other countries and regions.
$Gold - main 2604(GCmain)$ $E-Micro Gold - main 2604(MGCmain)$ $1-Ounce Gold - main 2604(1OZmain)$ $Silver - main 2605(SImain)$ $E-mini Silver - main 2605(QImain)$ $Silver - Mar 2026(SI2603)$
Comments
Great article, would you like to share it?
Great article, would you like to share it?