什麼是K線,
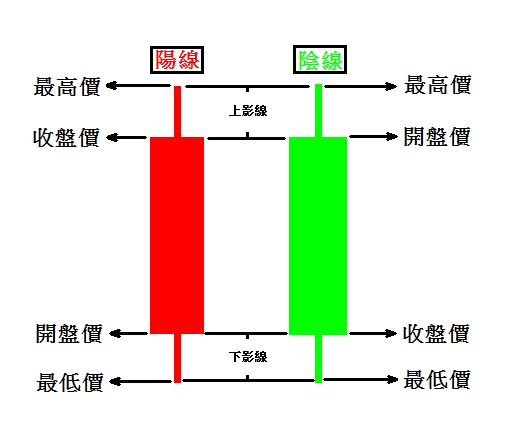
K線就是指將各種股票每日、每週、每月的開盤價、收盤價、最高價、最低價等漲跌變化狀況,用圖形的方式表現出來K線最上方的一條細線稱爲上影線,中間的一條粗線爲實體。 ... 當收盤價高於開盤價,也就是股價走勢呈上升趨勢時,我們稱這種情況下的K線爲陽線,中部的實體以空白或紅色表示。
Disclaimer: Investing carries risk. This is not financial advice. The above content should not be regarded as an offer, recommendation, or solicitation on acquiring or disposing of any financial products, any associated discussions, comments, or posts by author or other users should not be considered as such either. It is solely for general information purpose only, which does not consider your own investment objectives, financial situations or needs. TTM assumes no responsibility or warranty for the accuracy and completeness of the information, investors should do their own research and may seek professional advice before investing.
Comments