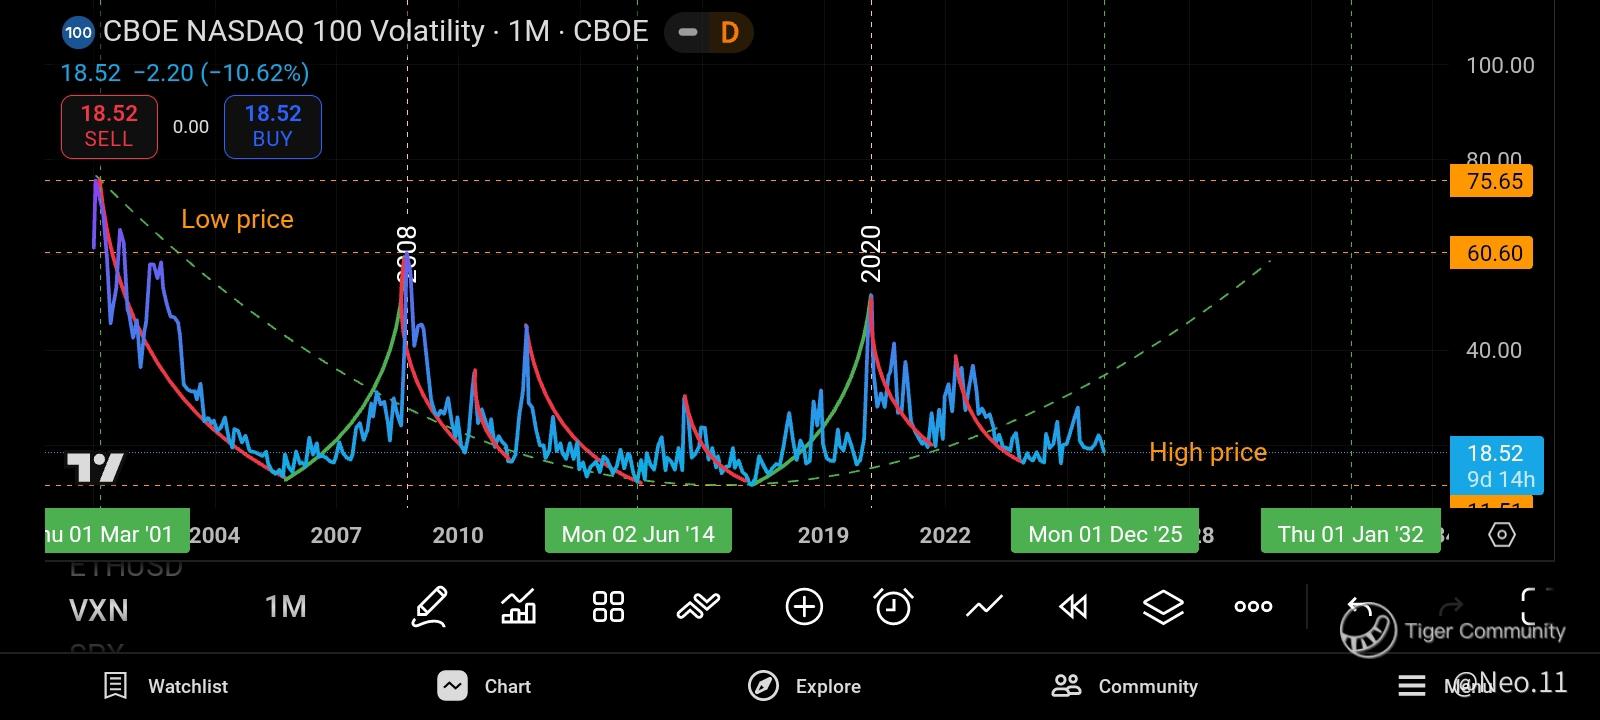
$NASDAQ(.IXIC)$
$S&P 500(.SPX)$
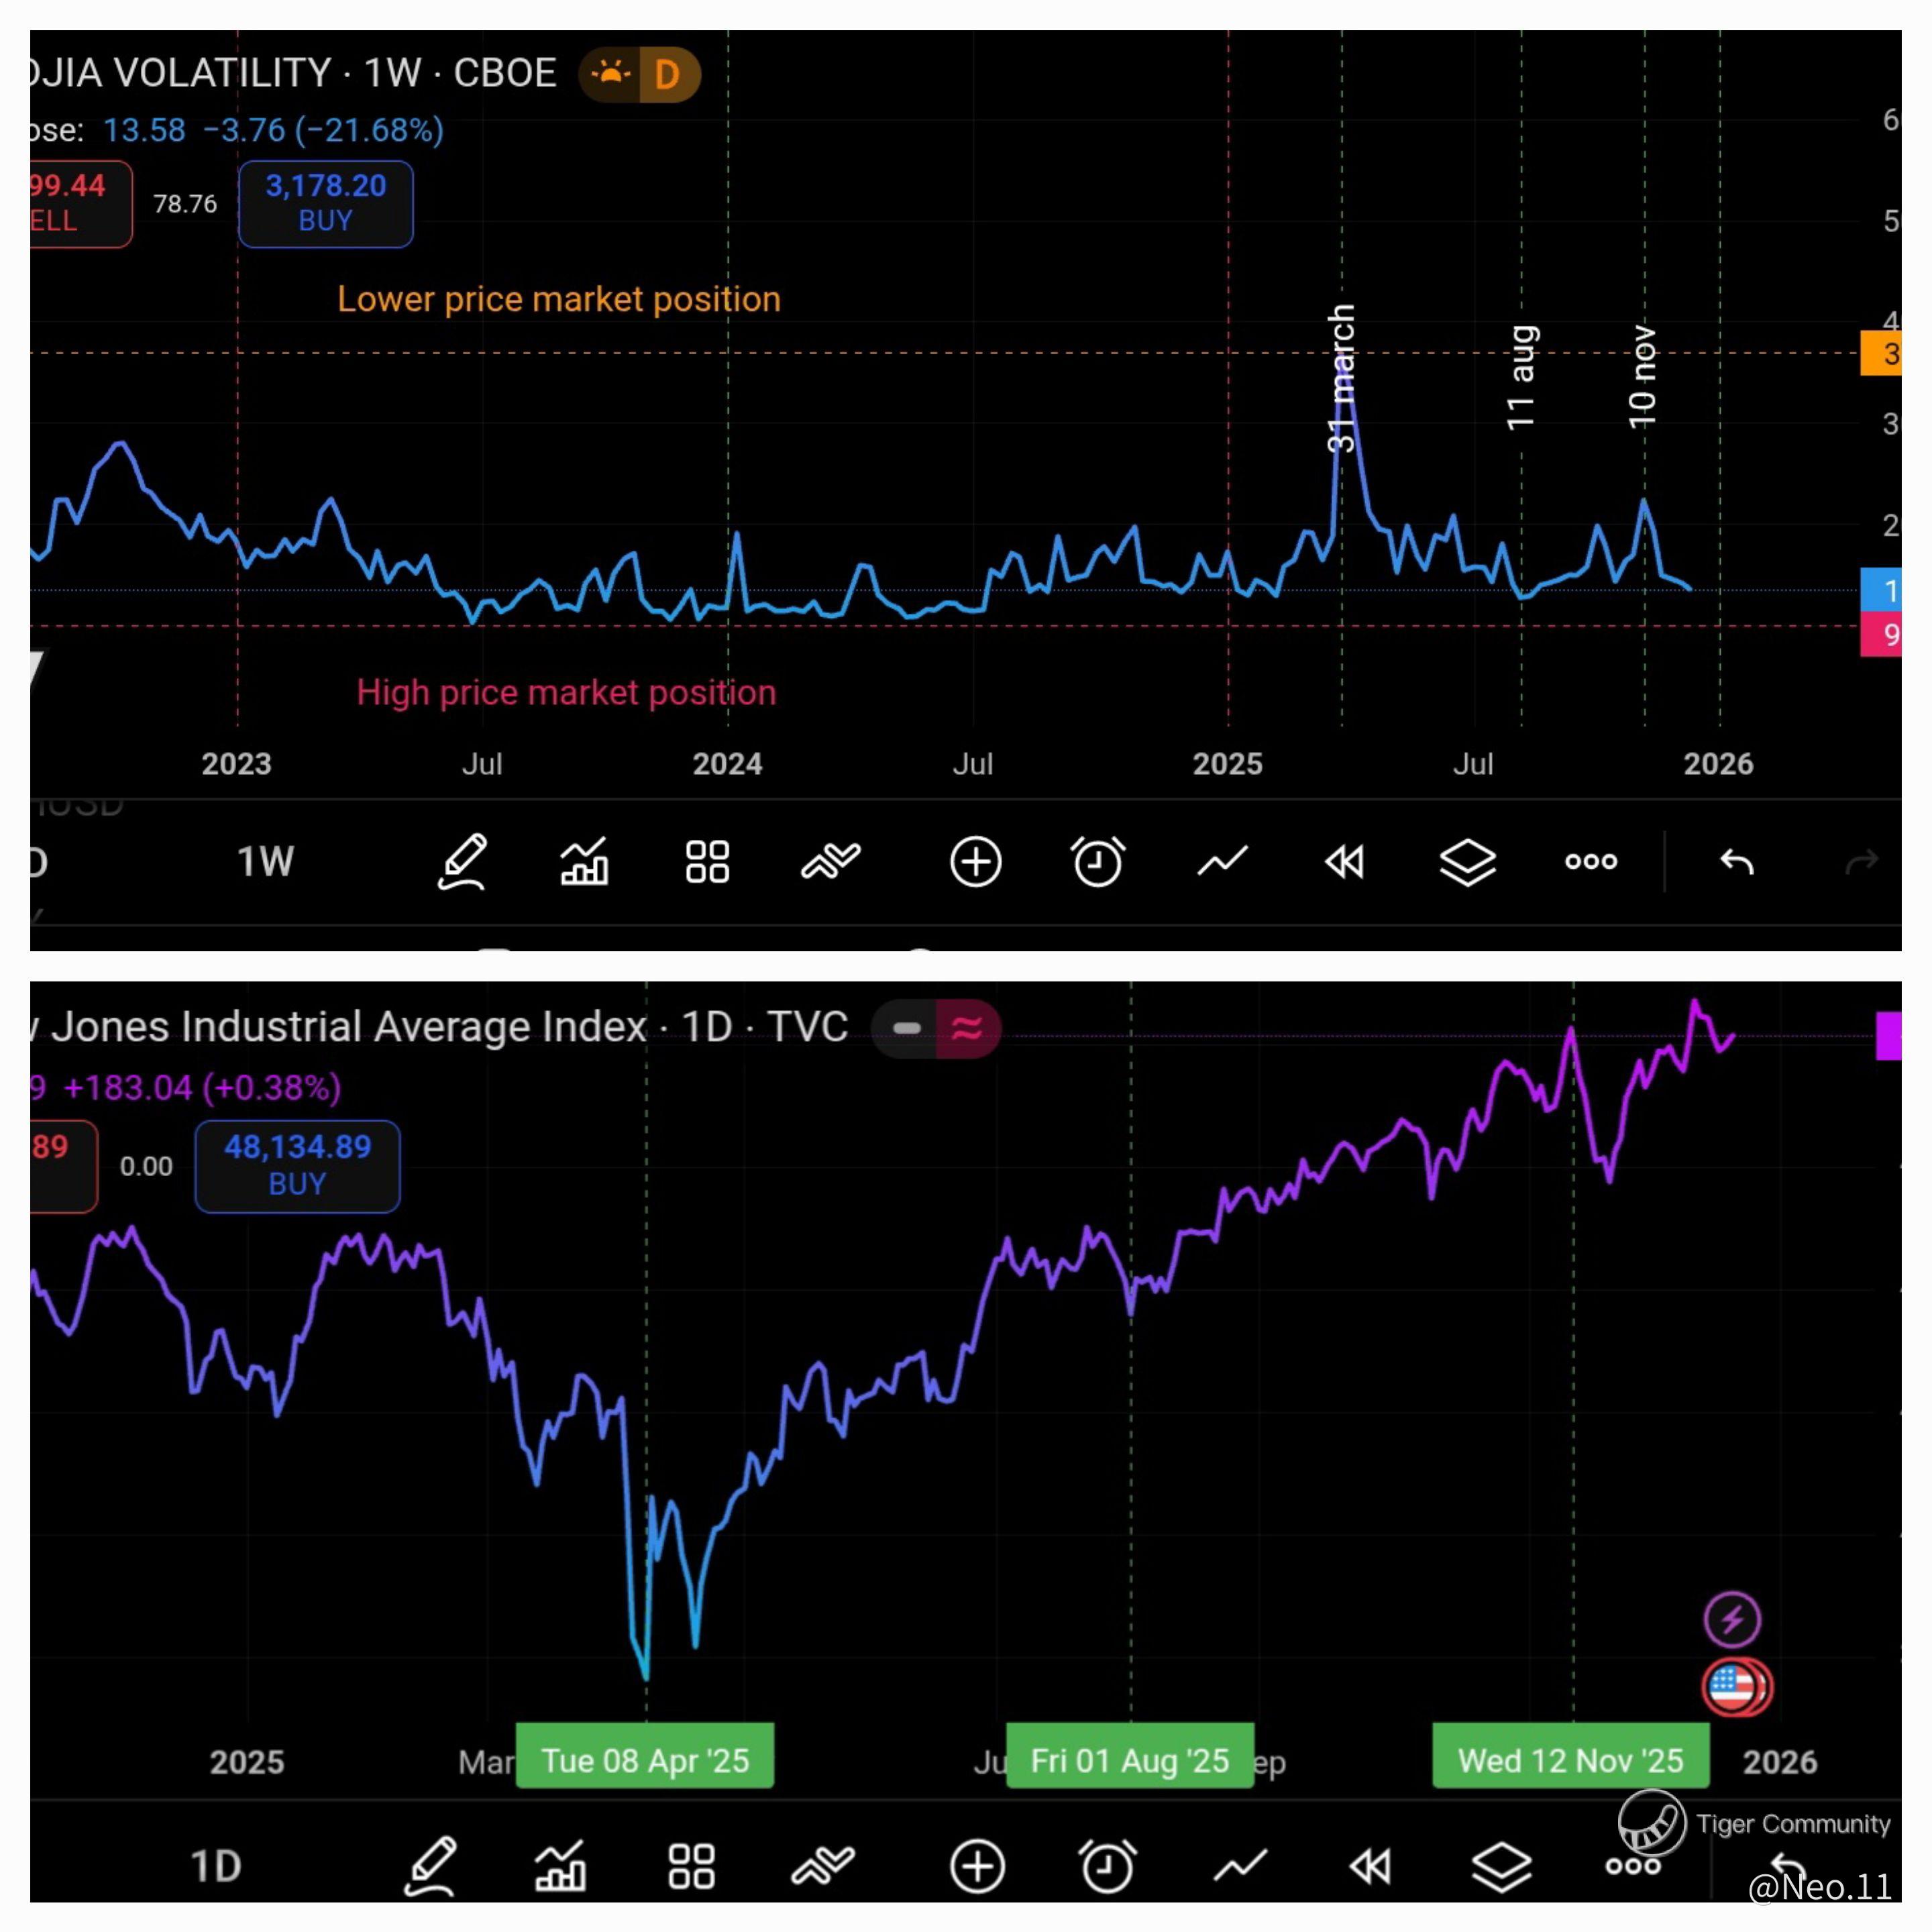
$Dow Jones(.DJI)$
"Santa rally" reasonable to drive in next years after Q4 on high market position for US market index but all stock market could be to downward trending after overbought on peak market position.
Everything should be have return % performance every years and back to draft in line position with cycle indicators tools. Makes point from gap point still works.
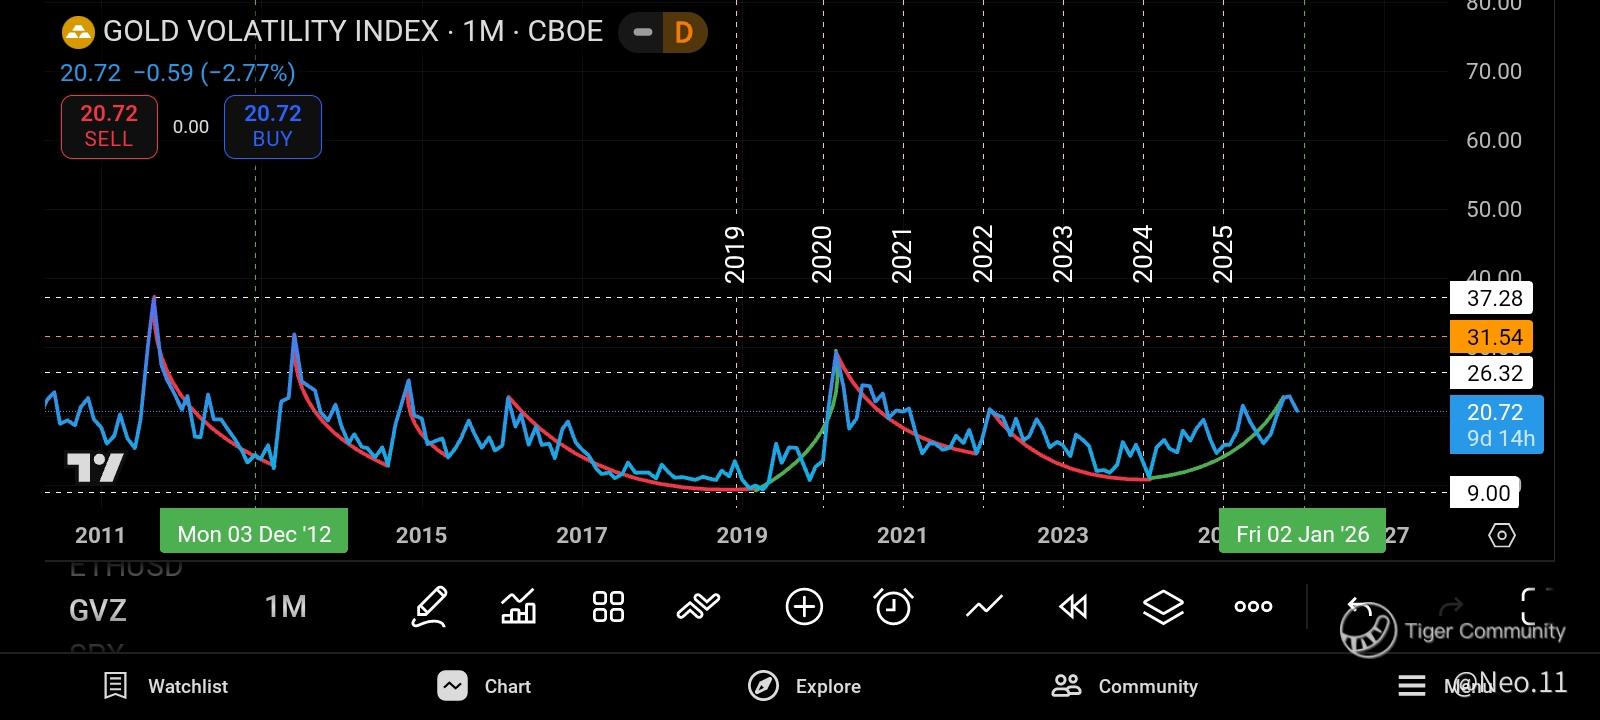
Remainder on the spot for next years 2026 from volatility index and historical momentum could be have " Triangle Interval time frame" to finder same line on position in curve.
Disclaimer: Investing carries risk. This is not financial advice. The above content should not be regarded as an offer, recommendation, or solicitation on acquiring or disposing of any financial products, any associated discussions, comments, or posts by author or other users should not be considered as such either. It is solely for general information purpose only, which does not consider your own investment objectives, financial situations or needs. TTM assumes no responsibility or warranty for the accuracy and completeness of the information, investors should do their own research and may seek professional advice before investing.
Comments