TradingKey - CoreWeave (NASDAQ: CRWV) has a rough week. The stock dropped 11.91% to end at $61.39 on Friday, making last week its worst week in over 11 months. Adding insult to injury, last week’s drops caused it to lose about 25% for the week and about 20% in October.
For me, this is more of a credit story than a demand story. Last week, CoreWeave's bonds and credit default swaps crossed over to distressed territory. The selling pressure from that news spilled over into other AI infrastructure stocks. The main catalyst for the stock is CoreWeave's Q3 results, expected to be released in mid-November. However, the company has yet to confirm this date.
What Triggered the Selloff
The worst day came on Wednesday, October 14, when the stock dropped about 15.5%. Hotter-than-expected U.S. inflation data lifted bets on higher interest rates, which raise borrowing costs for debt-heavy data center builders.
Bond markets reacted sharply. The yield on CoreWeave’s October 2031 bond briefly topped 16% on Thursday. Five-year credit default swaps, which insure against default, rose above 1,000 basis points to a record, implying odds above 60% of default within five years.
For me, the key point is that bond investors, not just stock traders, are now questioning the business model.
The Debt Load in Context
Last week, CoreWeave’s stock suffered its worst day on Wednesday, losing about 15.5%. Investors nervous about U.S. inflation expecting higher interest rates, and therefore higher borrowing costs, crushed bond markets.
CoreWeave’s October 2031 bonds spiked to a high yield of 16% on Thursday. Five-year credit default swaps, which protect against default, rose to record levels, topping 1,000 bps, implying an above 60% chance of default in the next five years.
Bond investors are now challenging the business model, and rightfully so. With a stock price north of $61, the company will still depend on open capital markets to roll over its debt.
The Demand Side Remains Exceptional
CoreWeave released its Q2 update with a very different story. Revenues for the quarter grew 112% to approximately $2.6 billion. Revenues backlog grew 246% to $104 billion. This also does not include the net new commitments of more than $25 billion signed early in Q3.
As expected, the company increased its guidance. Management expects revenues of $3.45 to $3.6 billion for Q3 and $12.4 to $13.2 billion for the full year with an annualized run rate of $18.5 to $19.5 billion at year end.
The Capex Gap
There are a few things, however, that raise eyebrows. For 2026, CoreWeave is expecting capital expenditures of $35 to $39 billion, which is approximately three times its expected revenue for the year. The contracted revenue is spread out over a long period of time, while the spending and interest on debt, which funds the investment, is in the near term. That is the crux of the bear case.
Nvidia and Analysts Push Back
There is some positive sentiment from Nvidia (NVDA). Jensen Huang, Nvidia's CEO, said CoreWeave is getting stronger every day and the cost of capital is falling. Nvidia owns approximately 10% of the company. Cantor Fitzgerald and Evercore also argued that the market is overreacting and kept their price targets at $176 and $200, respectively. The average price target is about $141.
Insider selling remains negative. Michael Intrator, the CEO, and related parties have sold close to $1 billion of stock since the March 2025 IPO, mostly under prearranged sales plans.
CoreWeave Technical Analysis: CRWV Plunges 12% Into $60.57 Support as RSI Turns Oversold
On the daily chart, CRWV closed at $61.39, down 11.91% from the prior close. Overnight prices bounced slightly to $63.19. CRWV gapped below $78.85 support and broke the range that has been in place since early September. The session low of $59.90 took out the $60.57 demand zone, which was the support zone from the late July low. CRWV is under the red moving average at $84.57 and the blue moving average at $88.26, with the red average under the blue average and a bearish trendline from August.
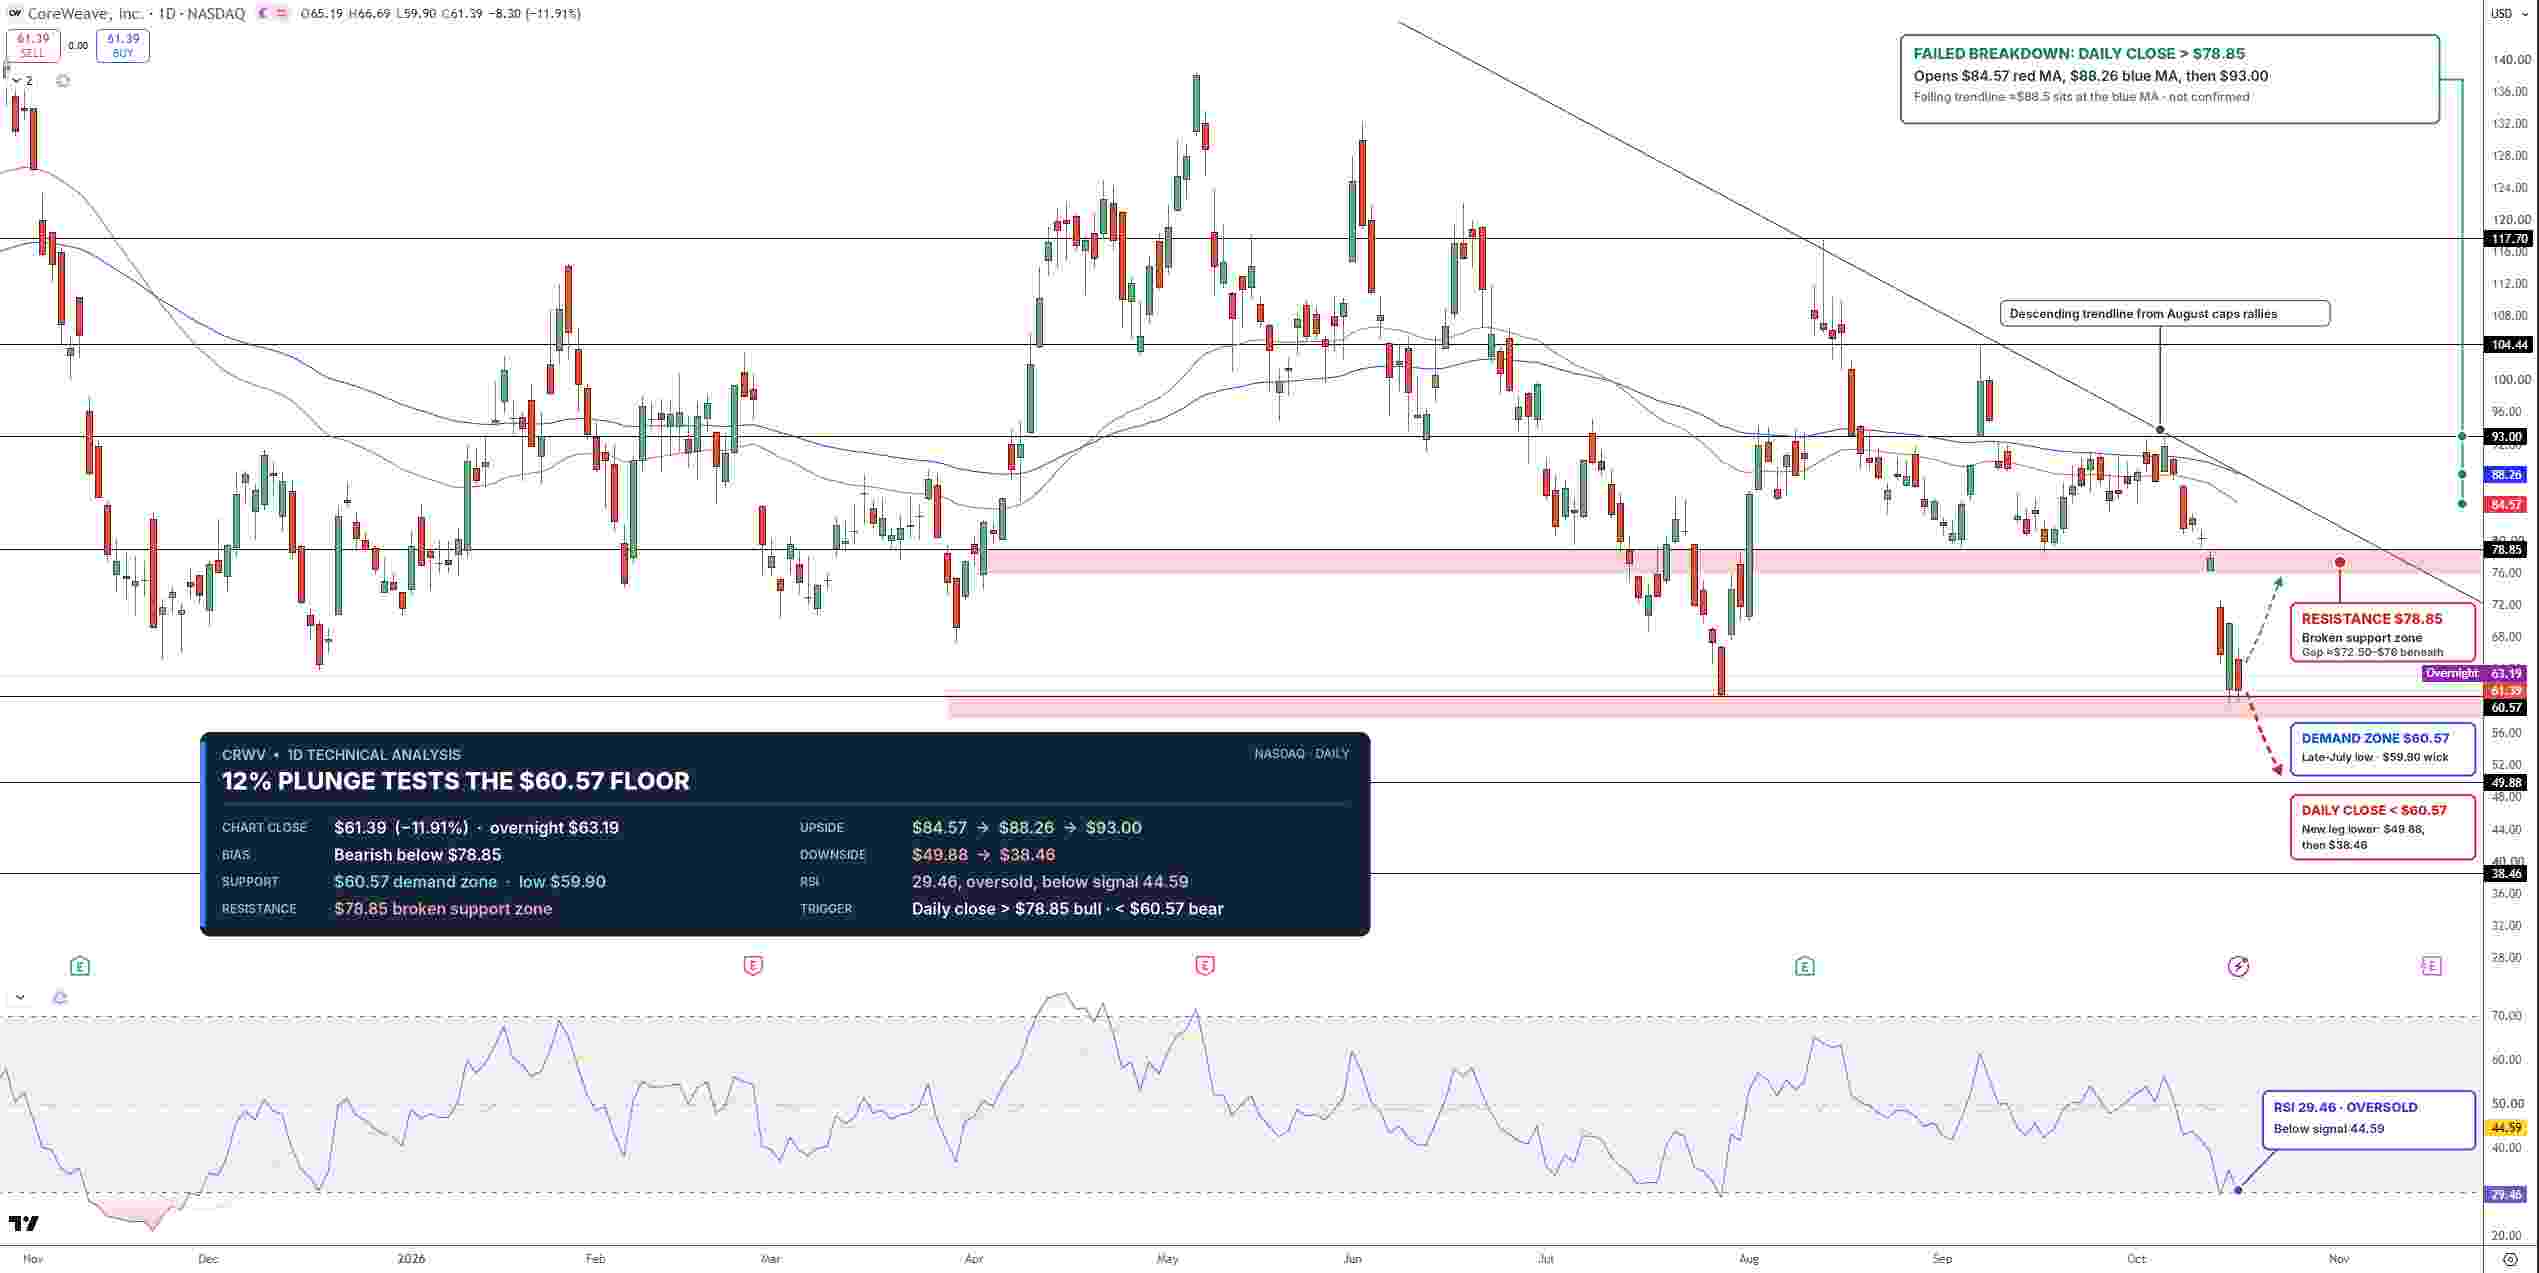
CoreWeave Stock Price Chart - Source: Tradingview
The RSI has fallen to 29.46 and is below its 44.59 signal line. Readings this oversold are typically seen at support zones and a bounce is typically seen after.
Immediate resistance is at $78.85. A close above this would bring the next resistance at $84.57, $88.26 and $93.00. A close below $60.57 would bring the next support at $49.88, and then $38.46. I am bearish below $78.85. Relief bounces from $60.57 are expected.
Key Levels
Last Close: $61.39, down 11.91% on October 16
Support: $60.57, $49.88, $38.46
Resistance: $78.85, $84.57, $88.26, $93.00
RSI: 29.46, below its 44.59 signal line
Bullish Trigger: Daily close above $78.85
Bearish Trigger: Daily close below $60.57
FAQs
Why did CoreWeave stock crash last week?
Last week, stock prices for CoreWeave collapsed after hot inflation data gave the market an even stronger expectation for the tightening of U.S. monetary policy and sent CoreWeave's bond yields above 16% and pushed its credit default swaps to new highs. The market estimated that CoreWeave would have roughly $51.6 billion of debt and leases, and interest costs would exceed operating profits.
What is the CoreWeave stock forecast this week?
CoreWeave's bias is bearish below $78.85. A close below $60.57 would open a path lower to $49.88 and $38.46. A break above $78.85 would change the bias to bullish.
Bottom Line
CoreWeave's demand story is strong, but the focus is on credit. The best opportunity to trade CoreWeave is from $60.57. The risks are rising bond yields, more dilution, and shipment delays. A close above $78.85 would negate my bearish view, while a close below $60.57 would confirm my bearish view.
Find out more
Comments